Ever dream about running your Python code in the Cloud? Or feel that Anaconda is way heavy to install, way overloaded with many not-for-you tools inside?
You know there must be something, somewhere, over the rainbow maybe, to do it. Something hanging like a juicy, roly-poly, mellow mulberry on a brand just slightly out of reach.
Congrats, you are in the right place to get it!
I recently discovered Google Colaboratory (short for Colab), an awesome, and most importantly, free cloud service tool for machine learning education and research, created as a Google research project.
For anyone who doesn’t already know, creating and running Jupyter Notebook on Colab is super easy, and it is rightly encapsulated in Google Drive that would require just a few clicks to get it open.
You can also upload existing notebooks, store notebooks, share notebooks, upload them directly to Google Drive or Github, and do just about everything else that you might want to be able to do. It feels almost too good to be true…
There are, of course, limits. Collab supports Python 2.7 and 3.6, but not R or Scala yet. You will be also notified of a ‘maximum lifetime’ limit of running notebooks that is 12 hours with the browser open, and the ‘Idle’ notebook instance is interrupted after 90 minutes. Now, you can take a look at my post on Setting up Anaconda and Jupyter Notebook, you will see what I mean by “easy” with Colab.
Open Google Colab notebook:
New notebook
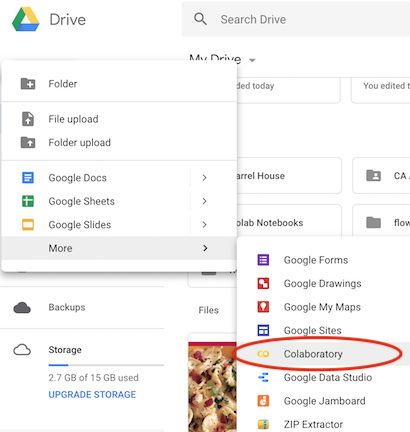
Head over to your Google Drive (technically assuming you have a google account) and create a new Colab file. Just click “New” and drop the mnue down to “More” and then select “Colaboratory”.
Or you can always visit directly: Colab site, and create a new file: File > New > New Python 3 notebook.
Existing notebook
Moreoever, opening notebooks from the Colab interface allows you to access existing files from Google Drive, GitHub, and local hardware.
From the tabs at the top of the file explorer, select a source and navigate to the .ipynb file you wish to open. The file explorer can also be accessed from the Colab interface by selecting File > Open notebook or using the Ctrl+O keyboard combination.
Share Google Colab notebook on GitHub
Click on File/Save a copy in Github, you will be prompted to log in to Github and authorize app once, and from then on you can simply save a notebook to one of your repositories. Each time you save, you can add a commit message for GitHub. After you save it to GitHub, you will get a link “View in Colaboratory” which opens your notebook directly in colab. This means anyone who opens your notebook doesn’t need to do any setup for Jupyter Notebook..
Get coding!
A. Mount your Google Drive
Very simple, you just have to run this code:
from google.colab import drive
drive.mount('/content/gdrive')
Then you will see a link, click on that and copy the code on the page, hit enter and you will see you have successfully mounted your drive
And hit refresh, your drive appears right there on the left hand side of the screen!
Let’s grab a quick look at the file list in your Drive:
!ls "/content/gdrive/My Drive/"
which is very useful…
B. Import libraries
Colab supports bunches of common libraries natively, we will just have to run the code, as usual, to call our friends to join the game:
import pandas as pd
import plotly.express as px
import matplotlib.pyplt as plt
import numpy as np
from bokeh.plotting import figure, show
from bokeh.io import output_notebook
Knowledge of the quality of a typeface is of the greatest importance for the functional, aesthetic and psychological effect.
Visualise Data
Now, award yourself with some beautiful charts.
What we are going to do is to perform data visualisation with plotly and bokeh . They both are very modern and graphing-dedicated libraries.
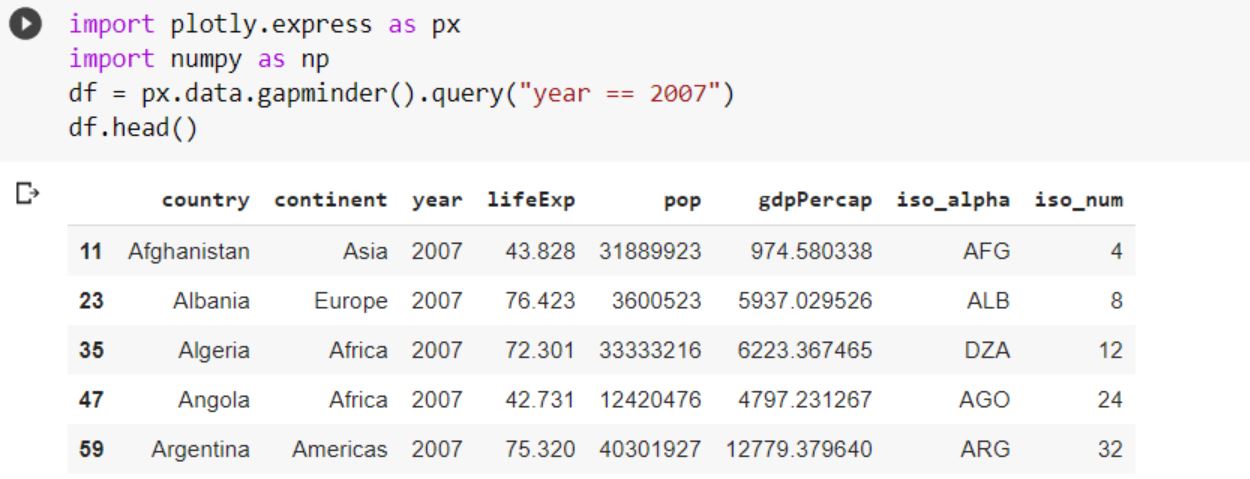
This data set contains information about life expectancy (lifeExp), population (pop), GPD per capita (gdpPercap), iso alpha indicators and iso numbers for each country per continent in 2007.
df["world"] = "world" # in order to have a single root node
fig = px.treemap(df, path=['world', 'continent', 'country'], values='pop',
color='lifeExp', hover_data=['iso_alpha'],
color_continuous_scale='RdBu',
color_continuous_midpoint=np.average(df['lifeExp'], weights=df['pop']))
fig.show()
Note: if you encounter error: treemap() got an unexpected keyword argument ‘path’ in plotly.express => just upgrade plotly using
pip install --upgrade plotlyOR
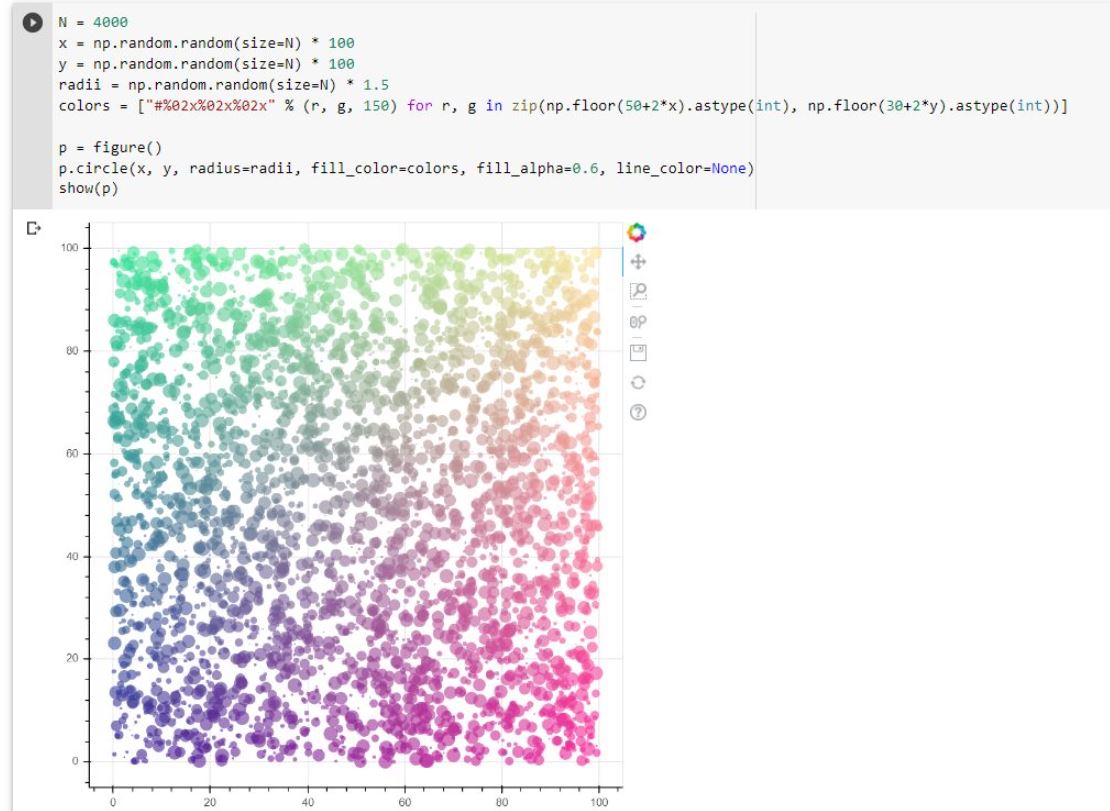
Trying some code with bokeh.
That’s all from me today. It’s your turn. Raise your hand, shine some light, and share your hard work with the world ^^